4 Tidy Data: Why and How
4.1 What is Tidy Data?
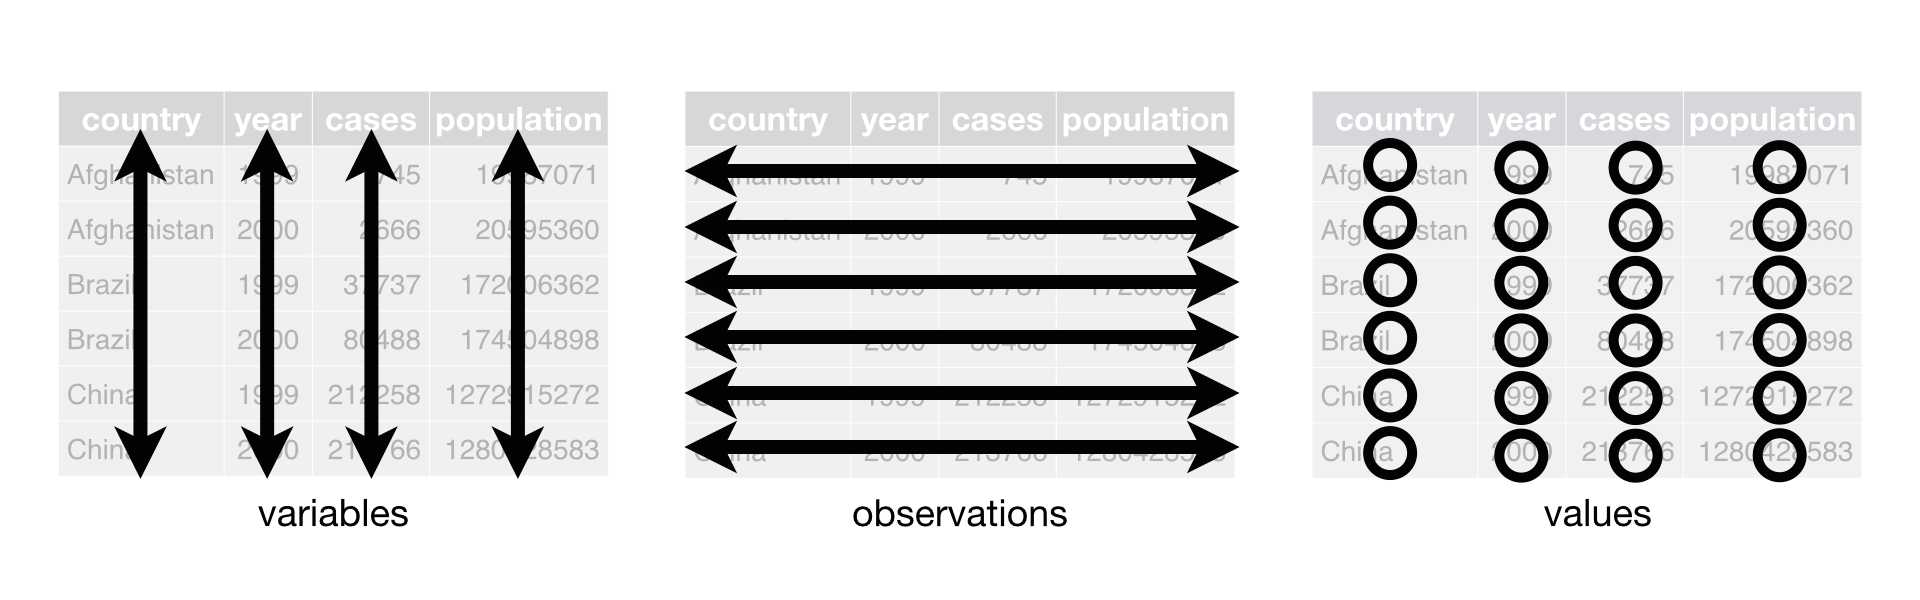
- each row corresponds to an observation
- each variable is a column
- each type of observation is in a different table
4.2 Why Tidy Data?
Tidy data enables us to do lots of things!
- Great ggplots
- Summarize/slice the data in multiple ways
- Enable Exploratory Data Analysis
- Ensure assumptions are met for methods
- Enable Confirmatory Data Analysis
4.3 Beware of columns masquerading as variables!
These columns are actually categories!
Ask yourself: do these columns go together as a single observation for your analysis?
Also ask yourself: What is the unit of observation?
library(tidyr)
fertilityData <- read.csv("data/total_fertility.csv", check.names = FALSE)
fertilityData[1:10, 1:10]4.4 Making data tidy: gather()
Use gather() when you need to make a bunch of columns into one column.
library(tidyr)
fertilityData <- read.csv("data/total_fertility.csv", check.names = FALSE)
#gather() takes three arguments: data, key, and value
#key is what you want your new categorical column to be named
#value is for the actual values in the columns
#We don't want the `Total fertility rate` column to be included as part of the
#gather() operation, so we use the `-` notation to exclude it.
fertilityDataTidy <-
gather(fertilityData, "Year", "fertilityRate", -`Total fertility rate`) %>%
select(Country = `Total fertility rate`, Year, fertilityRate) %>%
#remove na values (there are countries that have no information)
filter(!is.na(fertilityRate))
fertilityDataTidy[1:10,]4.5 Your Task: using tidy data
How would we find the average fertility within a year? Call the summarized data meanYearRate.
4.6 Making one column into many: spread()
Sometimes, you will need to go the other direction: take a long format dataset and make it into a more matrix-like format. This is necessary for such functions such as heatmap().
Let’s change things around and make the Country column into the variables (columns) in the dataset.
fertilityCountryColumns <- fertilityDataTidy %>%
#spread takes a key (Country) and value (fertilityRate) argument
spread(Country, fertilityRate)
fertilityCountryColumns[1:10, 1:10]4.7 Your Task - Who is the most democratic?
Load the dem_score.csv dataset in the data/ folder. Tidy it up using gather(). Which countries had the highest democracy score in 2007?
Hint: you’ll have to use your dplyr skills as well. Also, to remove characters, you can use str_replace(var, "X", "") in the stringr package to do it (what dplyr function should you wrap it in?). For more info, check out ?str_replace.
4.8 Challenge - if that was too easy…
Take a look at the who dataset (it’s built into tidyverse)
data(who)
who4.9 Make it look like this:
load("data/who_tidy.rda")
who_tidy4.10 Some Hints on the Challenge
Look at the documentation for separate(). You will first have to gather a bunch of the columns into a single column. Then you will have to apply separate() twice, with different parameters.
What does each column mean? Here’s some info from the data dictionary:
- The first three letters of entries in the key column correspond to new or old cases of TB.
- The next two letters (after the _) correspond to TB type:
relfor relapse,epfor extrapulmonary TBsnfor smear negative,spfor smear positive
- The next letter after the second _ corresponds to the sex of the TB patient.
- The remaining numbers correspond to age group:
014for 0 to 14 years65for 65 or older- etc.